
Marketplace Command Centre
One dashboard that shows how stays, tours, events and activities are performing, with recent bookings and the next thing to do.
These images are illustrations of the concept, not screenshots of the actual product.
Overview
A marketplace that spans stays, tours, activities and live events generates four different kinds of demand at once, and the usual result is four different reports that never line up. This concept collapses them into a single command centre: one view where the health of the whole marketplace is readable in a few seconds, and where the obvious next action is always one click away.
The illustration shows a dark dashboard with a persistent left navigation that reflects how the product is organized: dashboard, search, travel, hospitality, tourism, entertainment, bookings, favorites, provider and analytics, with a plan badge pinned at the bottom offering an upgrade for deeper insight. A collapse control tucks the rail away. Across the top sit a global search field, a notification bell with an unread count, settings and the account menu, so the same chrome carries across every surface in the product.
A row of four metric tiles opens the page: total revenue, bookings, active users and a conversion rate, each pairing a headline figure with a period-over-period change against the previous thirty days and a small trend line underneath. Every number shown is invented sample data. The design intent is that the tiles answer the question of direction, not just level, so a fall in conversion is visible next to a rise in revenue rather than buried in a separate report.
Below the tiles, three panels divide the work. A revenue-by-category breakdown ranks the four marketplace domains with a value, a share of total and a proportional bar each, over a selectable period, with a link through to the full report. A recent bookings list shows the newest reservations with a thumbnail, the listing name, the date and the trip shape, a status badge distinguishing confirmed from pending, and the amount, with links to open one booking or view them all. A suggested next steps panel turns the numbers into actions, offering routes into browsing stays, discovering tours and activities, and grabbing event tickets, with a prominent button into the wider marketplace.
As the overview counterpart to the one-plan idea, this concept is where the marketplace is watched rather than where a trip is planned. The categories on this page are the same domains discovery, booking and host tools work in, so a shift seen here leads directly into the search, listing and provider surfaces that explain it.
What this concept shows
- Four headline metric tiles covering revenue, bookings, active users and conversion, each with a period comparison
- A compact trend line inside every metric tile showing the shape of the last period, not just the total
- A revenue-by-category panel ranking stays, tours, events and activities by value, share and proportional bar
- A period selector on the revenue panel and a link through to the full report
- A recent bookings list with listing thumbnails, dates, guest or ticket counts, amounts and status badges
- Confirmed and pending booking states distinguished at a glance in the same list
- A suggested next steps panel routing into stays, tours and activities, and event tickets
- Persistent left navigation across every marketplace domain, plus global search, notifications and account controls
How it works
- Open the dashboard and read the four headline tiles to see revenue, bookings, users and conversion with their period changes.
- Compare the four marketplace domains in the revenue-by-category panel to see where value is concentrated.
- Adjust the period selector or open the full report when a category needs a closer look.
- Scan the recent bookings list for new reservations and check which are confirmed and which are still pending.
- Follow a suggested next step into stays, tours and activities, or event tickets to act on what the numbers show.
Who it's for
- Marketplace operators watching supply and demand
- Travel agency and corporate travel desk managers
- Hosts and operators tracking their own performance
- Product and commercial leads reviewing category mix
Illustrations
1 illustration of this concept. Select one to view it full size.
Marketplace Dashboard With Metrics and Recent Bookings
A dark desktop dashboard. A collapsible left rail lists dashboard, search, travel, hospitality, tourism, entertainment, bookings, favorites, provider and analytics, with a plan badge and an upgrade link at the bottom. The header holds a page title describing unified travel, hospitality, tourism and entertainment operations, a global search field, a notification bell with a count, settings and the account menu. Four tiles show sample figures for revenue, bookings, active users and conversion, each with a percentage change against the previous thirty days and a small trend line. Below, a revenue-by-category panel lists stays, tours, events and activities with amounts, shares and bars over a selectable period; a recent bookings list shows thumbnails, dates, guest or ticket counts, amounts and confirmed or pending badges; and a next steps panel offers routes into stays, tours and tickets. All data is invented.
Topics
- travel marketplace dashboard
- booking analytics overview
- revenue by category breakdown
- recent bookings list
- conversion rate metric tile
- travel operations command centre
- marketplace KPI dashboard
- confirmed and pending bookings
- suggested next steps panel
- tourism and events reporting
Related concepts
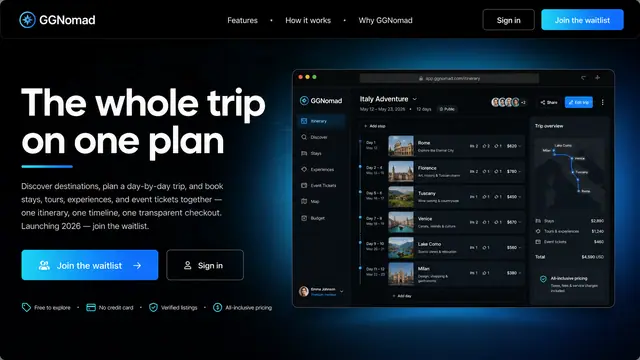
The Whole Trip on One Plan
Stays, tours, experiences and event tickets gathered into one itinerary, one timeline and one transparent checkout.
1 illustration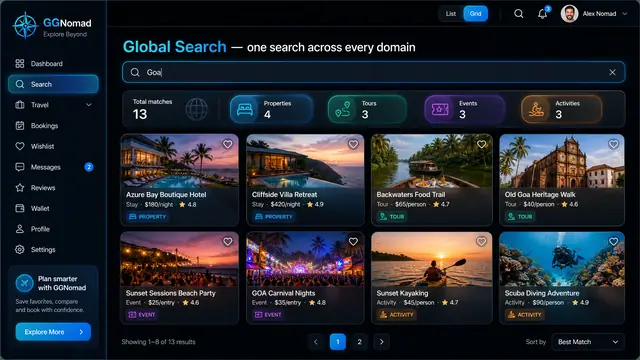
One Search Across Every Domain
A single query returns stays, tours, events and activities side by side, on desktop or phone, with a shortlist that keeps them together.
3 illustrations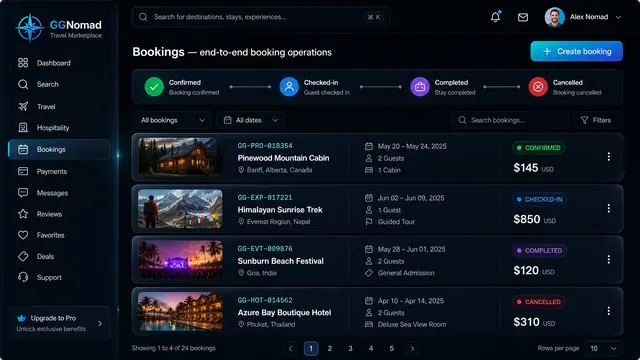
Booking Lifecycle and Audit Trail
Run every booking through a clear lifecycle and see exactly who changed what, and when, on an append-only audit trail.
2 illustrations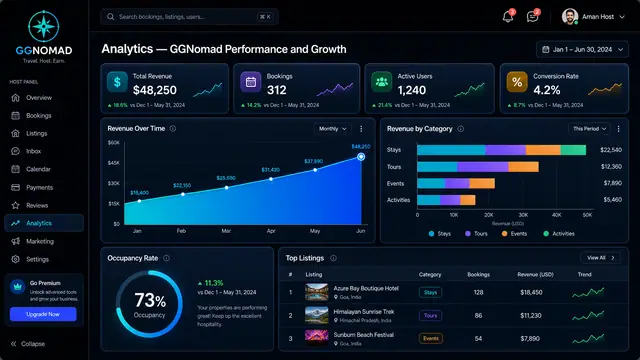
Host Analytics and Pricing Copilot
Revenue, occupancy and per-listing performance in one view, with rate suggestions that explain their evidence before a host accepts.
2 illustrations